
I’ve blogged about using network analysis to interpret datasets before – here and here – but only with reference to Google Fusion Tables. More recently – and thanks to a tip-off from Kent History postgrad Alice White – I’ve been playing with Gephi. Gephi is an open source network visualisation tool, and although it takes a little while to get into (especially establishing what format of data it will accept) excellent tutorials and detailed descriptions of the algorithms that can be applied to your data make Gephi ideal for serious researchers with novice technical ability upwards.
In order to better understand the Isaac Cruikshank corpus of satirical prints, I have been using Gephi to analyse the places depicted in his designs and comparing the patterns from publisher to publisher. Before this distance reading could begin, places had to be extracted from the prints. Frequently prints mirror scenes of urban drama occurring in specific places, such as Covent Garden Theatre in 1809. Other less ephemeral Cruikshank prints also use specific places to carry their satire. Peepers in Bond Street, or the cause of the lounge (Samuel Fores, 1793) works because it was in West End districts such as Bond Street where the latest fashions – in this case exposing ladies ankles – could be seen. Most prints however imply their location rather than state it: taking place in London but at no specific address, or in a generically rural area but close to no specific town. As these inferences and absences as just as significant as the specific locations depicted, studying the corpus as a whole requires the construction of a relational taxonomy for each print. For our purposes, this taxonomy runs from the most specific place depicted to the most generic: Peepers in Bond Street is therefore encoded as ‘Bond Street, London, England, Urban’; A Tartan Belle of 1792 (Samuel Fores, 1792) as ‘None [specific], Scotland, Rural’; A Fool and his money is soon parted (Robert Sayer, 1790) as ‘None [specific], England’. Doing so allows us to explore the relationships between specific plcaes (‘Bond Street’, ‘Paris’, ’11 Miles from London’) and generic places (‘England’, ‘Urban’, ‘At Sea’, ‘Holland’) in the designs Fores purchased from Isaac Cruikshank to exploit for profit.
Of three hundred and eighty-six Isaac Cruikshank designs published by Samuel Fores between 1788 and 1810, one hundred and fifty-seven (just over 40%) include no specific place information (note: I don’t claim that this corpus is complete, but it is large enough to be representative). Although this reveals that Cruikshank/Fores work dealt in specifics, a more nuanced picture emerges if we trace the directional relationship from the specific and to generic places which appear. This produces seven hundred and ninety-two specific to generic links. This figure exceeds the total prints (by factor of more than 2) because many prints have multiple links: in the case of A Tartan Belle of 1792 two links, ‘None>Scotland’ and ‘None>Rural’; for Peepers in Bond Street three links, ‘Bond Street>London’, ‘Bond Street>England’, and ‘Bond Street>Urban’. These links cluster around English urban scenes, the ranking of link destinations being England 34.5%, Urban 20.2%, London 14.2%, Rural 6.4%, and France 5% (with 19.7% remainder).
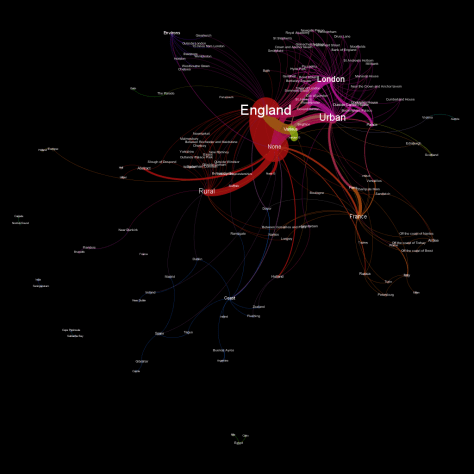
Converting this data into a network reinforces these patterns. The picture above shows a Force Atlas network for this Cruikshank/Fores corpus. Force Atlas uses a force directed algorithm based on the Fruchterman & Reingold model (1990) to emphasise complementaries. The resulting visualisation shows nodes (derived from place data) and edges (links between specific and generic places), the size of each node linked to the number of different nodes that interacts with it and the size of each edge linked to the frequency of this node-to-node link. Edge direction – the strength with which one node ‘directs’ it’s force at another via an edge – stabilises the shape of the network and gives it relational shape. Colouring is used to denote different ‘partitions’, effectively clusters of nodes and edges which comprise groups. As the model was developed from empirical social science research, the visualisation does not demonstrate abstract mathematics: resultantly nodes do not overlap, subverting the ‘maths’ in preference of emphasising the readability and structure of the network. What the network shows is the significance of the ‘England, London, Urban’ axis to Fores’ business, as well as prints depicting events in France (during and post Revolution). Intriguingly, the specific places around the ‘London’ and ‘Urban’ nodes contrast strikingly with the network surrounding the ‘Rural’ node, with a heavy ‘Rural’ to ‘None’ edge demonstrating a preference for non-specific rural settings. What this suggests is that although Fores sold Cruikshank prints with parliamentary themes akin to Gillray/Humphrey work, he also carried a core of prints which either used the rural as a stage for political drama (No grumbling (1795)), professional controversies (Vaccination against small pox, or mercenary & merciless spreaders of death & devastation driven out of society (1808)), or ridiculing the ageing beau monde (Young Ladies (1795), Young gentlemen in the dress of the year 1798 (1798)).
Distance reading does not however explain why these patterns emerge for prints published by Fores (and indeed the different patterns observable for other publishers, perhaps I’ll blog about this at a later date). This ‘why’ only emerges when we reintroduce a grounded understanding of how making and selling prints shaped their content. I don’t have time to go into making and selling Georgian prints right now (if you want to know more see here), but the international and specific urban locations of Cruikshank/Fores productions suggestion to me a speculative model of publishing: with large (100+) runs of impressions printed from ephemeral designs in order to capitalise on political and society news. Some of this risk associated with large runs was mitigated by Fores’ publishing prints by Isaac Cruikshank which either sought to anticipate or alternatively clung to the coat-tails of Gillray/Humphrey’s productions. Indeed this strategy of Fores mirroring his West End neighbour is striking revealed by a slew of copies of Gillray plates made by Charles Williams for Fores between 1803 and 1806 (see a post at the wonderful The Print Shop Window for more on this phenomenon). Moreover, the aforementioned rural scenes, especially the less ephemeral, mitigated overall business risk by having a long-tail as saleable objects. Yet this 22 year snapshot is unsatisfactory, for as Fores and Cruikshank’s relationship changed over time (in short: close in the 1790s, declined around 1802, reinvigorated by a young George Cruikshank around 1808 until Isaac’s death in 1811) so would the character of the content the former accepted.
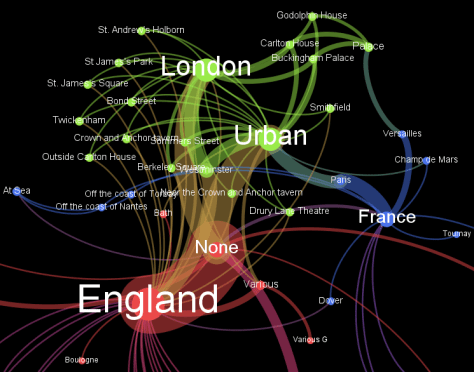
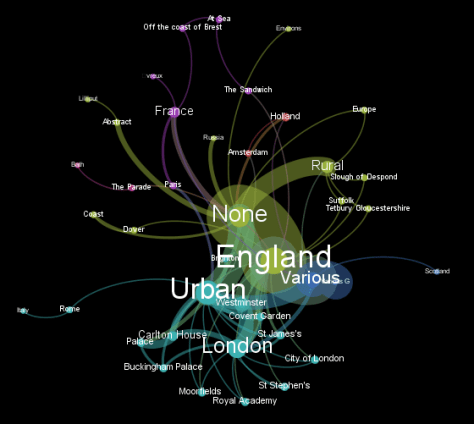
Again then we go back to the network graphs of Cruikshank/Fores prints, this time broken down into four chronological chunks (see below). One interesting trend observable from comparing these graphs is the decline in France as a location within – and hence subject of – the prints. I need to cross-reference this against Fores’ total output, but I suspect this suggests that Fores preferred another artist-engraver (perhaps Charles Williams) to report in international affairs at this time. Indeed by the final period (1804-1810) the Cruikshanks work for Fores is focused almost entirely on domestic scenes, exemplified by a slew of prints in 1809 on the Covent Garden Theatre old price riots and Mary Anne Clarke affair. The frequency of ‘Various>Various G[eneric]’ prints in 1794-1798 is explained by a large quantity of work Isaac undertook for Fores after George Woodward containing multiple figures commenting on the issues of the day – see for example Popular Opinions on Public Proceedings (1794). Of course there are other trends here which await careful analysis – on which I welcome any thoughts – but the main point of this work is to emphasise the utility of network graphs for thinking through large amounts of data, how time-specific chunks can help us overcome the tendency of networking analysis to flatten time, and that data raw needs material context to give it meaning.


You must be logged in to post a comment.